TEACHING ALL VOLUMES SUBMIT WORK SEARCH TIEE
VOLUME 6: Table of Contents TEACHING ISSUES AND EXPERIMENTS IN ECOLOGY
ISSUES: FIGURE SETS

Figure Set 3: Causes of intense elk browsing on cottonwoods and willows during the 20th century.

Purpose: To practice interpreting graphical data; to use the data to address the question of why browsing by elk in Yellowstone was so intense during the 20th century.
Teaching Approach: “Pairs share”
Cognitive Skills: (see Bloom's Taxonomy) — knowledge, comprehension, interpretation
Student Assessment: minute paper or essay quiz

FIGURE SET

Figure 3 Numbers of wolves and elk

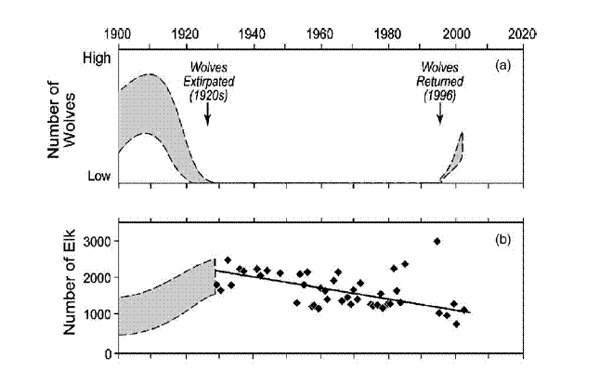
Figure 3. Twentieth century time series of (a) wolf populations and (b) elk population estimates and trend line for the Upper Gallatin Basin in the Yellowstone area. Shaded portions of a graph reflect uncertainty; elk census data are represented by closed diamonds. From Ripple and Beschta (2004a).

<top>