
VOLUME 6: Table of Contents
TEACHING ISSUES AND EXPERIMENTS IN ECOLOGY
Population modeling is valuable tool to rapidly assess how ecological factors impact the population growth rate of a species. In this experiment population modeling is used to assess the potential effectiveness of biocontrol on the population growth rate of the invasive Lespedeza cuneata. Life cycle figures represent what size classes are represented in the study species and the possible transitions between these size classes. In this experiment there are four size classes and two types of seed that can contribute to a seed bank. The life cycle figures also highlight the potential transitions from one year to the next. For example, an arrow going from small to medium would indicate the transition from plants that were small in one year growing to medium plants in the following year. Data gathered from actual seed set and growth is used to calculate the probability of these transitions. These values can then be placed into a transition matrix; matrices are created for each treatment (see example below).
Population modeling is valuable tool to rapidly assess how ecological factors impact the population growth rate of a species. In this experiment population modeling is used to assess the potential effectiveness of biocontrol on the population growth rate of the invasive Lespedeza cuneata. Life cycle figures represent what size classes are represented in the study species and the possible transitions between these size classes. In this experiment there are four size classes and two types of seed that can contribute to a seed bank. The life cycle figures also highlight the potential transitions from one year to the next. For example, an arrow going from small to medium would indicate the transition from plants that were small in one year growing to medium plants in the following year. Data gathered from actual seed set and growth is used to calculate the probability of these transitions. These values can then be placed into a transition matrix; matrices are created for each treatment (see example below). Researchers can then incorporate matrix values into modeling programs, such as R (which is freely available on the internet) to calculate a value, λ, which represents the growth rate of a population under the conditions when the data was collected. λ is extracted fairly easily from the demographic matrix (it is the dominant eigenvalue of the matrix). A λ value which is below 1 represents a population that is declining, a λ value at 1 is a population that is at stasis (neither growing nor declining), and a λ value which is above 1 represents a population that is growing. One would predict that an invasive species, which is successful, would display a population growth rate (λ) which is above 1. Therefore a successful use of biological control would bring the population growth rate (λ) below 1.
Finally, elasticity analyses are used to determine what vital rates λ is most sensitive to. Elasticity matrices yield elasticity values for each vital rate. The highest elasticity value in the elasticity matrix is associated with the vital rate that λ is most sensitive to. Therefore, even small changes in this vital rate will result in significant changes to λ. Biological control is expected to be most successful at reducing the population growth rate (λ) when the vital rates that are affected by the control agent have high elasticity values.
1. Look over the example given below to understand how values from a life cycle graph go into a matrix.
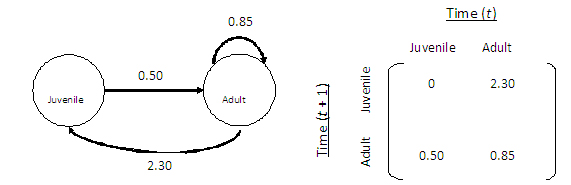
2. Spend a few minutes examining Figure 2 to ensure that you understand what the circles, arrows, and numbers represent. Then place the numbers where they belong in the control matrix (you can download and print Handout 1). Pair up with your neighbor to check your interpretation.
3. Follow the instructions below (also available as Handout 2) to use the R Program 'Lespedeza' to calculate the population growth rate (λ) of plants in the control treatment. Pair up with your neighbor to check that your lambda values are the same.
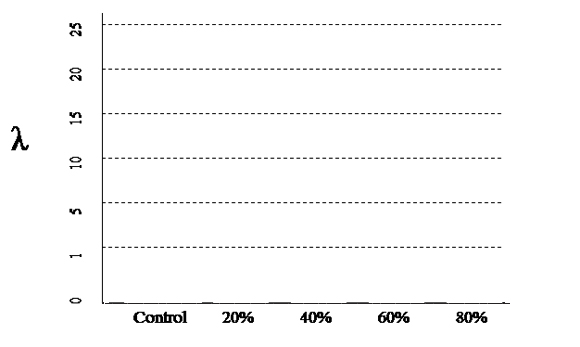
4. Fill in the bar graph below (you can download and print Handout 3) based on the results you calculated for the control treatment in R. Fill in the bar you make. Now make predictions based on possible hypotheses about how λ will change with the different treatments. Remember: a population growth rate (λ) below 1 is declining and above 1 is increasing.

5. Provide brief answers to the following questions or follow directions if indicated.
6. When you are finished, compare your responses with your neighbor.
7. Follow the instructions below for changing data in the R Program to change the matrix, and re-calculate the population growth rate (λ) for each herbivory treatment. These instructions are also available as Handout 4.
Treatment |
Small-Medium Transition Probability |
Control (0%) |
0.64 |
20% |
0.62 |
40% |
0.31 |
60% |
0.39 |
80% |
0.23 |
8. Compare your findings with your neighbor and then individually complete the questions and figure below regarding the population growth rates of the invasive Lespedeza cuneata in different clipping treatments. The questions and figure are available as Handout 5.
9. Calculate the elasticity matrix for the plants in the control treatment. To do this, you must first make sure the matrix in the 'lespedeza' program is showing the values for the control treatment (i.e., the small to medium transition should be set at 0.64), and re-run the program as in step 7a. In the console, you can type in 'A' to see your matrix, 'lambda' to see the population growth rate associated with that matrix, and 'e' to see the elasticity matrix. Once you have your elasticity matrix, proceed to the next step.
10. Provide brief answers to the following questions (also available as Handout 6) based on the elasticity analysis of the population growth rate of the invasive Lespedeza cuneata.