
VOLUME 2: Table of Contents
TEACHING ISSUES AND EXPERIMENTS IN ECOLOGY
Introduction:
In this investigation, we will examine the effects of competition for resources on reproductive output within and between
two species of parasitoid wasps.
Lab Objectives:
At the conclusion of this lab, students will be able to...
Ecological communities are composed of populations of all species in a habitat. The structure of a community will be determined
in part by the dynamics of the interactions between the species in the community. Interactions between two species can be direct
or indirect (i.e., mediated through other species).
In even a simple natural community, hundreds of different species of plants and animals interact with one another. In spite of this diversity,
however, we can identify categories of interactions that have different effects on population growth (Table 1). The categories are defined by
the direction of the effects on the interacting species.
In addition to interactions among species, interactions among individuals within a species can also be important in structuring a community.
Within-species interactions can affect the population dynamics of the species, which in turn will influence interactions among species.
Intraspecific competition occurs when different individuals of the same species or population compete for a resource. These interactions
can be fierce because the individuals require the same limited resources to survive and reproduce. When different species are vying for the
same food, habitat, or some other environmental resource it is called interspecific competition. These interactions are typically somewhat
less intense. This is because while the requirements of two species might be similar, they can never be as close as they are for individuals
of the same species.
| Table 1. Categories Of Direct Interactions Between Two Species In The Same Community | ||||
| Name of interaction | Type of contact | Direct effect on species #1 | Direct effect on species #2 | Other aspects of the relationship |
| Neutral relationship | Two species are linked only indirectly through interactions with other species. | 0 | 0 | Each species has a neutral relationship with most species in its habitat. |
| Commensalism | A relationship that directly helps one species but does not affect the other much, if at all. | + | 0 | Commensalism, mutualism, and parasitism are all cases of symbiosis. |
| Mutualism | Benefits flow both ways between the interacting species. | + | + | Better viewed as two-way exploitation than as cozy cooperation. |
| Predation True Predators Grazers |
Predator attacks and feeds upon a series of prey but does not take up residence in or on them. | + | — | Prey generally dies. With grazers, plant might or might not die. |
| Parasitism Parasites Parasitoids | Parasite feeds on tissues of one or more hosts, residing in or on them for at least part of their life cycle. | + | — | A host might or might not die as a result of the interaction. |
| Interspecific competition | Disadvantages may flow both ways between species, or the superior competitor may be largely unaffected. | — | — | Generally less intense than competition among members of the same species. |
0 means no direct effect on population growth.
+ means positive effect; — means negative effect.
Consider, however, the theoretical case of two species that occupy the identical niche. Gause (1934) studied two protist species
that both fed on the same bacterial cells. When he combined them in a single culture, one always drove the other to extinction. Many
other experiments have since supported Gauses Law, now called the Principle of Competitive Exclusion. It states that any two species
that utilize identical resources cannot coexist indefinitely or complete competitors cannot coexist (Hardin 1960).
Many experiments have demonstrated that the more two species in a habitat differ in their resource use, the more likely it is that
they can, in fact, coexist (Krebs 1994). Even two species with a great deal of overlap may live together for some time, although
competitive interactions often suppress the growth rate of one or both of them. Over time, an interesting phenomenon called resource
partitioning may occur. Members of each species may come to specialize in a subdivision of some category of similar resources.
For example, if both feed upon apples, one may feed upon small green fruits and the other upon larger, riper ones.
The Lotka-Volterra model was developed to allow ecologists to predict the potential outcome when two species are in competition
for the same resources. Basically, the model attempts to account for the effect that the presence of one species will have on the
population growth of the other species, relative to the competitive effect that two members of the same species would have on each
other.
The equation for the population growth of species 1 is:

And for species 2, it is:

where:
If the values for each equation are known (or can be estimated empirically from the results of an experiment), then the equation
can be used to predict the potential outcome of a competition (i.e., whether they can co-exist or if one will eventually exclude
the other). The values for K1, K2, a12, and a21 are used to plot the
isoclines of zero growth (i.e., where dN1/dt or dN2/dt equal
zero) for both species on the same graph, and the resulting sums of population growth vectors (trajectories) are used to determine
the outcome of the competition (Figure 1).

Figure 1. Example graphs of isoclines of zero growth for which species 1 and species 2 coexist (at left), and species 1
competitively excludes species 2 (at right).
The Lotka-Volterra competition model describes the outcome of competition between two species over ecological time. Because
one species can competitively exclude another species (Figure 1) in ecological time, the competitively-inferior species may increase
the range of food types that it eats in order to survive. However, the response of species to interspecific competition in evolutionary
time is often the opposite of what occurs in ecological time. Competitors generally will specialize on particular resource types. This
resource partitioning that occurs over evolutionary time actually results in decreased or the absence of competition between the two species.
Although they are not particularly closely related to one another, the life histories of two parasitoid wasp species,
Melittobia digitata and Nasonia vitripennis, are quite similar. Both species are capable of using the same host, although
in nature they used different hosts. Melittobia are about half as large as Nasonia, but both are quite small and completely
harmless to humans.
Their complete life cycles are relatively short (2-4 weeks at 25o C), and also quite similar (Figure 2). Females lay numerous eggs
through the host covering. The eggs hatch to become larvae that consume the host, then change to pupae, and finally metamorphose
to an adult stage. In Melitobbia digitata, the adult females may have either normal or stunted wings. The normal winged adults
disperse from the host to search for new food resources. The flightless females will lay their eggs on the same host from which
they emerged, or disperse to a new host within the same nest (Freeman and Ittyeipe 1976, Côsoli and Vinson 2002).
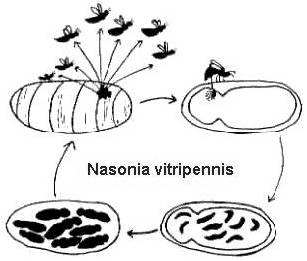
Figure 2. The life cycle of Nasonia vitripennis on a Neobellieria bullata host pupa (drawing by Bethia King). The life
cycle of Melittobia digitata is the same, although individuals at all stages are smaller.
There are about 70,000 known species of parasitoids worldwide (9% of all insects), but estimates of their number run as high as
800,000 (Strand 2002). Of the described species, about 80% are members of the order Hymenoptera, as are the two species you
are using in this lab. In nature, hosts can be parasitized by more than one species of parasitoid, all competing for the same resource
(Stand 2002). Since the host species may itself be a parasite on another species, the ecological effects of that competition on
community structure can be very complex. For example, Swaine jack pine sawflies (Neodiprion swainei Midd.), which can attack,
defoliate, and kill large stands of jack pines in North America, play host to 11 different species of parasitoid wasps. It appears that
most of these species coexist because they partition the host resource among them by parasitizing different stages of the hosts life
cycle, or different segments of the host population (Price 1972). One member of the parasitoid guild that attacks sawfly cocoons is an
introduced species (Pleolophus basizonus). It is a superior competitor and its presence determines the abundance of some of its
competitor species (Price 1970). Although competition can affect parasitoid community structure, spatial and temporal variation in host
resources may be even more important in determining parasitoid species richness, even in the presence of interspecific competition
among parasitoids (Hawkins 2000).
Parasitoids whose hosts are important pests on crops or forest trees are sometimes intentionally released as biological controls on
pest populations. Where more than one species of parasitoid attacks the same host, it is important to understand the nature of that
competition before making releases. If the different parasitoid species are capable of co-existing by means of resource partitioning,
control of the pest host may be best achieved by introducing some or all of the parasitoid species. On the other hand, if the competitors
limit each others populations because of their competitive interactions, then maximum control of the pest species might be achieved by
releasing the most efficient of the parasitoid species by itself (Amarasekare 2000).
______________________________________________________________
Materials and Methods:
Overview of Data Collection and Analysis Methods:
Lab 1:
The categories of interactions discussed in Table 1 can seem quite straightforward when one is simply reading about them.
But if you were to observe two unfamiliar animals interacting, how would you decide what label to apply? Could you predict the outcome
of the interaction? How could you test your prediction?
The two parasitoid wasps presented in this laboratory investigation seem to occupy similar niches. We are interested in the interactions
between the two species. In addition, we want to be able to quantify the effect of one species on the other.
Each group should:
Each group will share their experimental design with the rest of the class. Together as a class, we will develop
a consensus experimental design.
Based on the consensus experimental design, each person should set up one replicate culture for each treatment.
See Handling Parasitoids below. We will pool the data from the entire class for analysis.
Weekly checks:
Each week, each person should inspect their cultures to see if any adult wasps have emerged. You should record the date
that you first see emerged adults for each culture. Nasonia cultures should be frozen 21 days after they were established.
Melittobia and mixed species cultures should be frozen after 42 days.
Lab 2 (6 weeks after Lab 1):
Each person should count the number of offspring produced in each replicate culture. Enter your data into a spreadsheet
so that the data for the class can be pooled. Use the pooled data for estimating the parameters for the Lotka-Volterra
competition model and for statistical analysis of the effects of competition.
In your groups, discuss how the data can be used to quantify the parameters of the Lotka-Volterra competition model
(see Quantifying the Lokta-Volterra competition model below).
Also, discuss what particular treatment comparisons can tell us about the relative importance of intraspecific and
interspecific competition in these two species of parasitoids (see Guidelines for Data Analysis below).
Handling Parasitoids:
Adults of both parasitoids, Melittobia digitata and Nasonia vitripennis, are very "user friendly." Although females possess
normal wings and can fly, they do not do so readily. However, they are negatively geotaxic (i.e., they move up, away from
gravity). When a few females from a culture are shaken out onto a horizontal surface, then covered with an inverted glass
vial, they will readily climb into the vial and up the sides. Once you have wasps in a vial, you can easily add a host pupa,
then plug the vial tightly with cotton. Large numbers of individuals can be efficiently handled in this way. The adult wasps
can also be manipulated with short pipe cleaners, to which the wasps will temporarily adhere.
Quantifying the Lotka-Volterra competition model:
The Lotka-Volterra competition model was described and defined with equations in the Introduction. As noted there, if the values for
each equation can be estimated empirically from the results of an experiment, then the equation can be used to predict the potential
outcome of a competition (i.e., whether the two species will co-exist or if one will eventually exclude the other). The values for
K1, K2, alpha12, and alpha21 are used to plot the isoclines of zero growth
(i.e., where dN1/dt or dN2/dt equal zero) for both species on the same graph, and the
resulting sums of population growth vectors (trajectories) are used to determine the outcome of the competition.
Based on our experimental design, we need to determine the values of these parameters. Recall that the carrying capacity for a
population is the maximum number of individuals that can survive in a habitat. For simplicity in this experiment, we have defined
the habitat of the parasitoids as a single host. In reality, of course, a habitat would likely contain more than one mud-dauber nest
or blowfly puparium, and so there would be many potentially exploitable hosts. To determine the carrying capacities of the two
species, we need to know the maximum number of offspring of a given species that can be produced on a single host when only
that species is present. With this in mind, data from which treatment would be used to estimate the carrying capacities of
Melittobia and Nasonia? (Remember that at carrying capacity all host resources will be used.)
Estimating the competition coefficients (alpha12, and alpha21) is a little more complicated. Recall that the equation
for the population growth of species 1 is:
When all of the host resource is used by the parasitoids, then a population can no longer grow. In other words, dN1 /dt = 0.
This condition will occur when K1 - N1 - alpha12*N2 = 0. To find alpha12,
we need to solve for it (i.e., do a little algebra) and then substitute values for K1, N1, and N2.
Above, we described how to find the carrying capacities. Assuming that Melittobia is species 1, use its carrying capacity for
K1. The number of Melittobia and Nasonia offspring produced in interspecific competition are N1
and N2, respectively. With this in mind, data from which treatment would be used to estimate N1 and N2?
The same approach that you used to calculate alpha12, can be used to calculate alpha21.
Now that you have calculated all of the parameter values, you can use these values to plot the zero growth isoclines and predict
the outcome of competition between Melittobia and Nasonia.
Guidelines for data analysis:
We can use comparisons between different treatments to explore the relative importance of intraspecific and interspecific
competition. First, identify what type of competition, intraspecific or interspecific, if any, is occurring in each treatment.
After you have done this, think about all of the comparisons between pairs of treatments. What does each of the comparisons
tell us? It might be helpful to produce a chart that lists the comparisons and what they mean. Since all of the comparisons
involve two treatments, they can be analyzed statistically using t-tests.
______________________________________________________________
Questions for Further Thought and Discussion:
*** Note: Answers to many of these questions and numerous other comments by the contributing author can be found in the "NOTES TO FACULTY: Comments On Questions for Further Thought" page.
______________________________________________________________
References and Links:
Populus can be downloaded from www.cbs.umn.edu/populus.
______________________________________________________________
Tools for Assessment of Student Learning Outcomes:
Assessment has been carried out in a variety of ways at the different institutions that have used this exercise. In all cases, students
are evaluated based on a scientific paper written by each student individually, or by students in a group. In some cases, students are
evaluated on both first and second drafts of a paper.
The scoring rubric for the papers varies with instructor. Below is an example scoring rubric used at Morehouse College for a results
summary, which has all of the components of a scientific paper except the methods. In this evaluation rubric, audience concerns the
choice of appropriate audience by the student. Students are expected to write their report as if it were a scientific paper. So, the
appropriate audience is one of peers who have not conducted the experiment but who are scientifically literate. Reports written to the
instructor or to other students in the class do not have the appropriate audience. Format is the overall organization of the report in
sections that have parallel organization and build on each other. For example, the Discussion should evaluate the findings reported
in the Results and put those results a larger context. The Discussion should also address the hypothesis stated in the Introduction.
| Results Summary Evaluation (50 points possible)
| |
| Introduction and Title Page (10 points) | _____ |
| Results (10 points) | _____ |
| Discussion and Conclusions (10 points) | _____ |
| Literature Use and Citations (10 points) | _____ |
| Format, Audience (10 points) | _____ |
Comments: | |
At the introductory level, students turn in all class-generated tables, the responses to the Discussion Questions, and weekly notes on the
progress of the investigation. In addition to individual scientific papers, students could present the results of the experiment in the form of
group scientific papers, group oral presentations, or group poster presentations. However, since all of the students are carrying out the
same experiment and therefore presenting the same results, individual or group scientific papers would be the most effective.
______________________________________________________________
Tools for Formative Evaluation of this Experiment:
In the ecology course at Morehouse College, each student is asked to evaluate each laboratory exercise on a 10 point scale in terms
of the perceived efficacy of each study in reinforcing their knowledge and understanding of the subjects covered in the ecology lecture
course. In addition, the students are asked which exercises were the least and most enjoyable and which increased their understanding
of the scientific method the most. This information is used to choose and modify exercises used in subsequent semesters.
In the ecology courses at Emory University and Radford University, each student is asked which exercises they liked the best and
which they liked the least. Students sometimes provide comments as to why they rated the exercises in the way that they did.
Again, this information is used to modify exercises used in subsequent semesters.
An extensive discussion on Evaluation appears in the Teaching section of this site.