
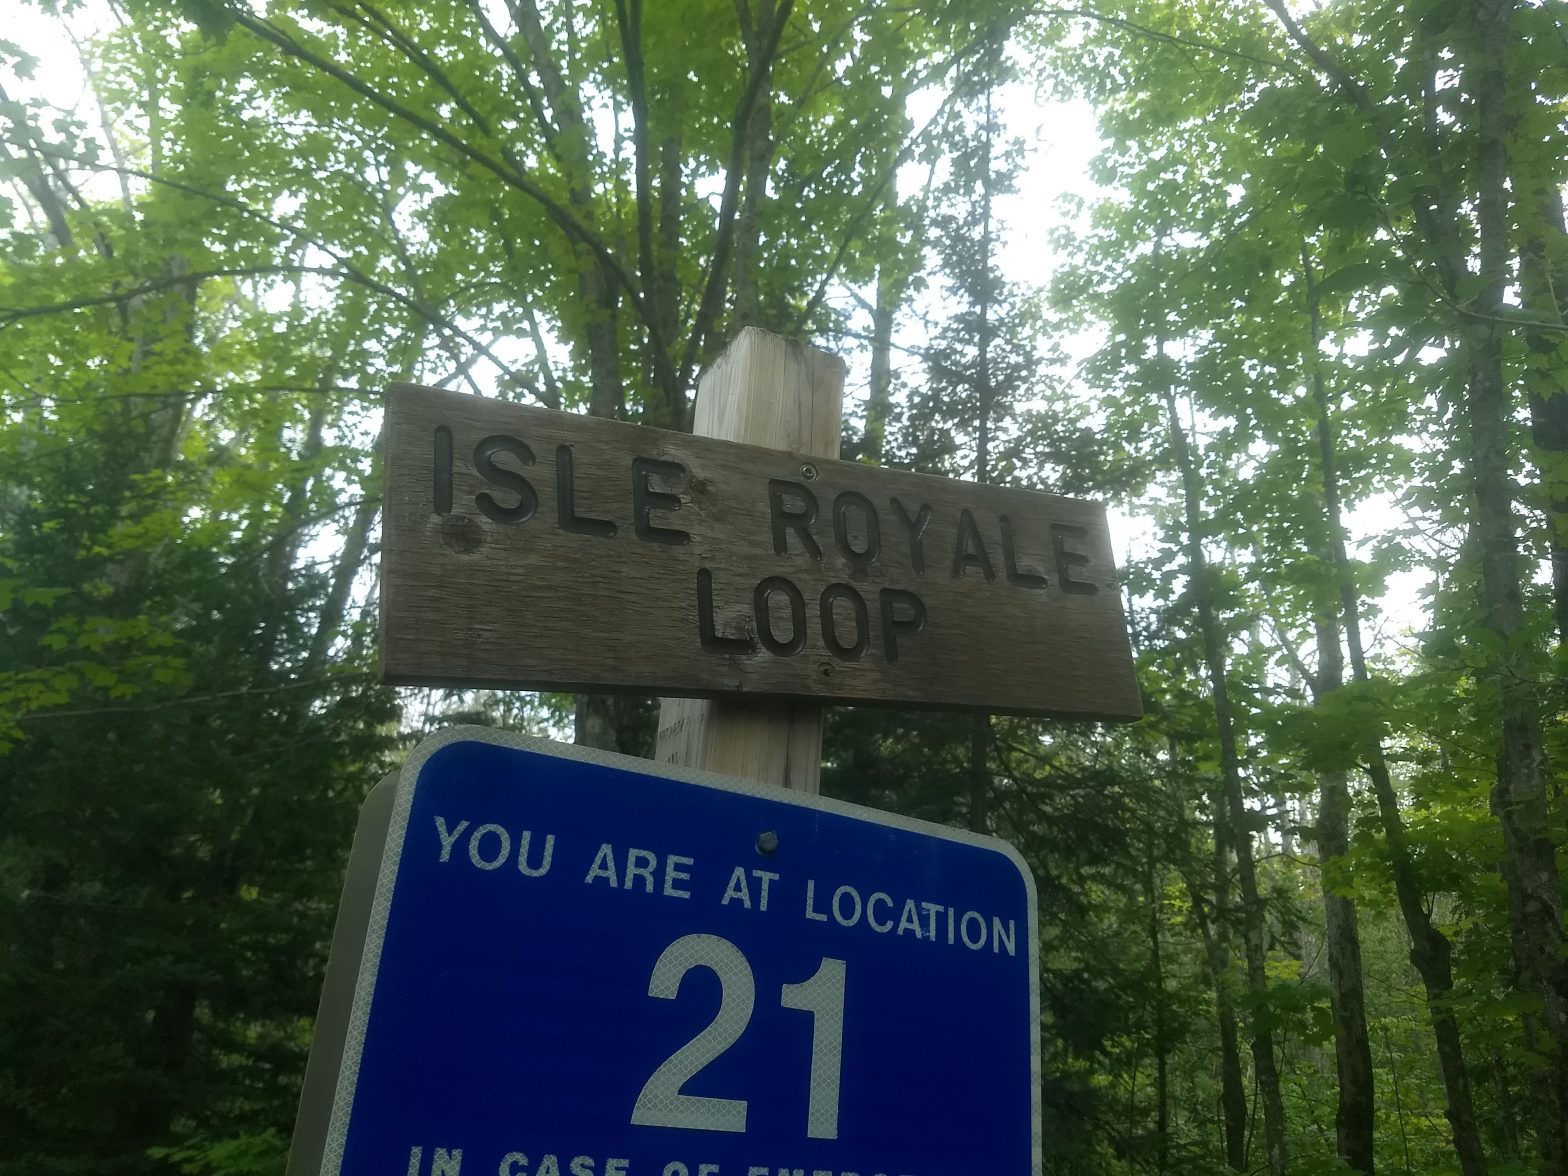
My time among the birds, moose, and amazing wilderness of northern Michigan has now (mostly) come to an end. It was a whirlwind summer of adventure, exploration, and some deep, juicy data science! I hope you find the fruits of my journey interesting.
What did I find?

Normally, methods are supposed to precede results. You may ask—as per Pink Floyd’s The Wall—“How can you have any pudding if you don’t eat yer meat?” But since I’m a grown man and not a British schoolboy in a 1979 music video, I can do what I want. If you’re interested in how I got these results, I’m sharing that later in the post.
Moose time!
So did the intense moose foraging affect Isle Royale’s bird communities? Well . . . uh, we’re still not quite sure about that. When I ran scenarios with and without the island-wide moose population size, they had almost the exact same predictive power1. Their quality was so similar, that we can’t really say which is more accurate. However, to me this is still surprising: the idea that the number of moose across a 200 square mile island can say anything about which birds you find in one given spot is pretty crazy. Honestly, this is better than I expected.
If we look at the scenarios incorporating moose (which are equally as valid as the moose-less versions), we find a few cool things. Firstly, it looks like the average nesting height of birds increased from ~6 feet when moose were rare to ~7.5 feet when moose were abundant. Not a huge change, but perhaps moose are disrupting ground-nesting birds! I also found that many birds are less likely to be found when the current moose population is high, but are more common when the moose population seven years prior was high. (Interestingly, birds that nest in deciduous shrubs have the opposite pattern, perhaps because moose grazing makes the environment more shrubby?)
But there’s more!
Since we kinda expected that moose population would be incredibly significant, I had a backup plan. Isle Royale has been collecting bird data for decades, but all the parks in the Great Lakes region have been counting birds since around 2010. That’s when the Great Lakes Inventory and Monitoring Network (GLKN) stepped in and made sure everyone was on the same page, especially with how parks should collect and record similar types of bird data. With this data at my fingertips, I decided to compare how bird communities were changing between parks and over time.
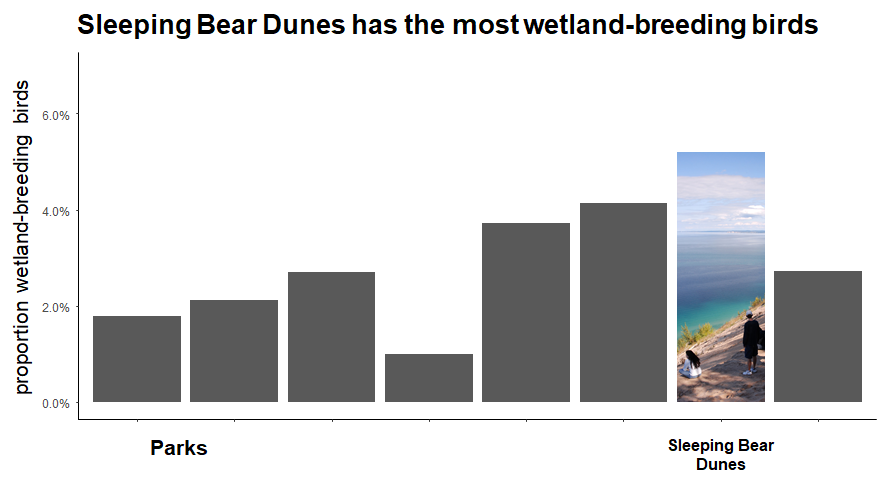
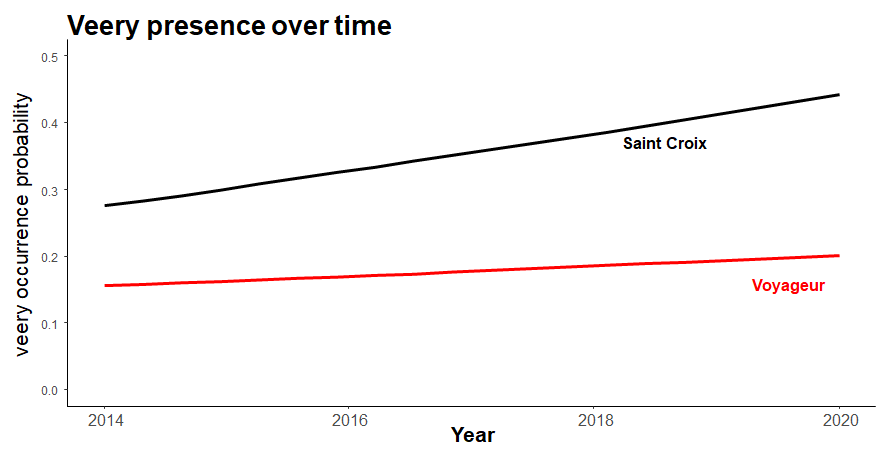
Below, I have included a few example tidbits of what I found, graphed for your viewing pleasure!
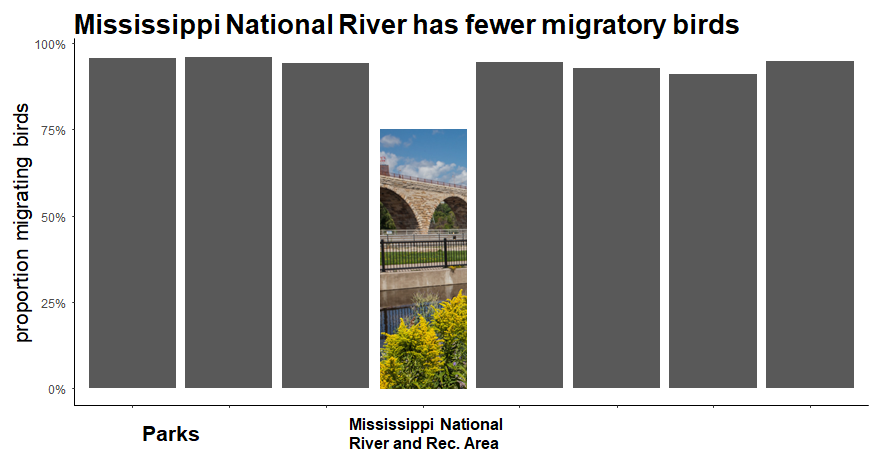
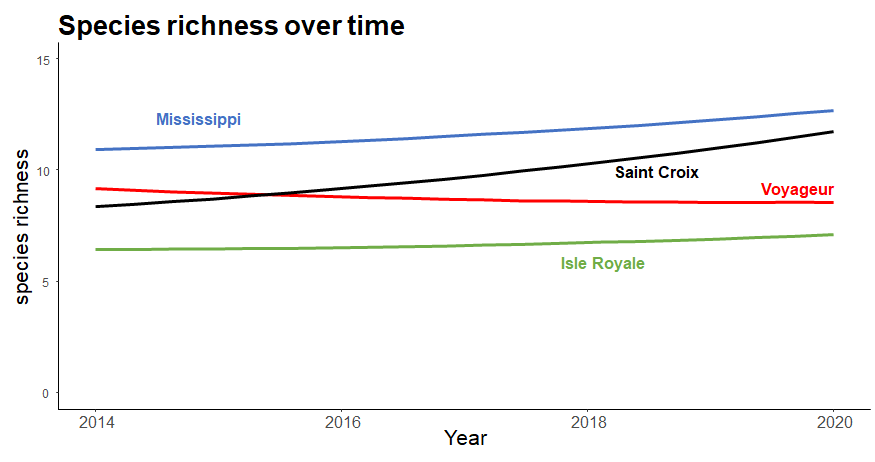
But perhaps the most important takeaway: I found that the parks are not immune to the recent continent-wide bird population declines. If a species is declining across North America, it is likely declining even in these near-pristine parks. It’s sad, but it makes sense: birds that migrate here from as far away as southern Brazil will spend time in many countries. Protecting their breeding grounds isn’t enough to ensure their population stays strong.
What did I do?

Ah yes, time for “the boring part.” I’ll keep it simple though! For the analysis, I learned how to use Hierarchical Modelling of Species Communities (HMSC), which is, to quote its creator, “a model-based approach for analyzing community ecological data.” Essentially HMSC is a way of investigating which species you find where and why. The idea is actually pretty simple: species are usually found in environments that match their traits. For example, if one area has more shrubby trees, you might expect to find more shrub-nesting birds there, right?
To use this approach, I needed bird counts, bird traits, and environmental measurements. The bird surveys fulfilled the first requirement, but let me tell you, 25 years worth of field data is NEVER in good shape. Typos, misidentifications, and duplicates abounded, and I had to fix this data up before it would work in the analysis. For the bird traits, I talked with my ornithologist collaborators and used data found in the recent, incredibly famous “Hey all the birds are dying, you guys!” paper2. Lastly, took the park’s vegetation survey and island-wide moose counts to describe the environment.
There is much, much more to these models, but my brevity is for your benefit, dear reader. The full story is one full of sound and fury, but is ultimately, signifying nothing. Ahem, anyway. Every time I wanted to create a scenario, I had to run HMSC on my computer for hours and hours. In fact, these models started taking so long that I eventually had to learn how to run them on my university’s super-computers. (Made me feel like an elite hacker or something cool like that)
Anyway, it was a grueling, yet rewarding summer experience! If you have any questions or just want to get in touch, shoot me an email or hit me up on Twitter.
- The WAIC scores were virtually identical between models that included moose population as a parameter and those that didn’t. As a rule of thumb, we say that if models are within two AIC points of each other, they both have “substantial support.” In this case, ΔAIC was 0.008…
- Fun fact: while trying to use their data for my own analysis, I found a small error in the paper! The authors had forgot to include a column in their supplementary table that I needed. A quick chat with my man Kenny (listen, we go waaaay back) fixed the issue and got me the required data.