Blue Carbon and Seagrass Mapping
by Krti Tallam
Citation:
Maria Laura Zoffoli, Pierre Gernez, Philippe Rosa, Anthony Le Bris, Vittorio E. Brando, Anne-Laure Barillé, Nicolas Harin, Steef Peters, Kathrin Poser, Lazaros Spaias, Gloria Peralta, Laurent Barillé. Sentinel-2 remote sensing of Zostera noltei-dominated intertidal seagrass meadows. Remote Sensing of Environment, Volume 251, 2020, 112020, ISSN 0034-4257, https://doi.org/10.1016/j.rse.2020.112020.
Blue carbon. When I think about it, I think of a perfectly calm, gentle wave. This term has been floating around for the last several years, but what does it mean… and why is it important?
Well, blue carbon is the carbon sequestered by the world’s oceanic and coastal ecosystems, which includes algae, seagrasses, macroalgae, mangroves, salt marshes and other plants in coastal wetlands. Recent research has in fact demonstrated that blue carbon ecosystems, such as seagrass meadows, have the capacity to sequester large amounts of carbon, surpassing even highly productive terrestrial ecosystems like tropical forests. But there’s a caveat (of course): the local economic value of this ecosystem service can vary widely, as it is site-specific.
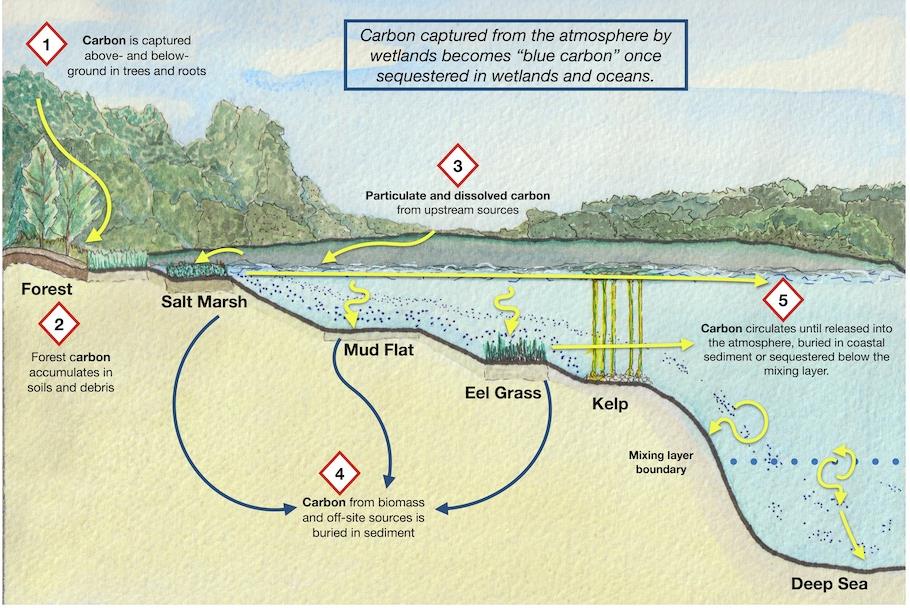
Image source: Salish Magazine 2020
Due to the ecosystem services that they provide, seagrass meadows are considered to be indicators of coastal ocean health. At the same time, seagrass ecosystems are vulnerable to natural and anthropogenic threats, including impacts generated in adjacent marine and terrestrial ecosystems, which are responsible for the worldwide reduction and fragmentation of these valuable habitats. Such impacts include disease, natural disasters, nearshore urbanization and coastal development, dredging, reduction in water quality, introduction of non-native species, thermal stress, climate change, sediment contamination, and sea level rise.
So what do we do?
Well, in order to establish a reference baseline of seagrass status, and to efficiently monitor, manage, and protect seagrass ecosystems, detailed knowledge of their worldwide spatial distribution and temporal dynamics is needed, in terms of percent cover, biomass, and primary production. But, of course, there are challenges: mapping seagrass distribution is very challenging due to its widespread and dynamic nature. Large uncertainties therefore remain in global estimates of seagrass cover.
Obtaining and maintaining up-to-date information on seagrass distribution has been identified as one of the main challenges for seagrass conservation.

Seagrass plots (left) and seagrass meadows (right) in France. Image source: North Carolina Environmental Quality 2020
What is remote sensing and how can it play a role here?
Since the 1990s, remote sensing has been proven to be an efficient, synoptic, and cost-effective tool to monitor and map seagrass. In fact, since the launch of the Landsat mission, seagrass mapping has benefited from an uninterrupted increase in satellite data quality, computing capability, and integration with in situ (local, on-site) measurements, which together have boosted the use of remote sensing data for seagrass studies.
But, if we think about it for a second, we would also begin to question the use of remote sensing for marine landscapes: how would that even be possible? The use of remote sensing techniques is more challenging for seagrass landscapes than for terrestrial ones, due in part to differences in spatial extent, which is usually much smaller for seagrass habitats. And, even if we were to solve this problem, once seagrass areas are identified, quantitative information on cover and biomass distribution is still needed to study the spatio-temporal (belonging to both space and time) seagrass dynamics and to model their carbon assimilation (the incorporation of carbon from atmospheric carbon dioxide into organic molecules).
Okay, so what can we do at this point?
Well, the launch of the first Sentinel-2 (S2) satellite in 2015 by the European Space Agency (ESA) enables new possibilities. So, Dr. Zoffoli and team from the Université de Nantes in France explored the potential of S2 to map biological indicators of intertidal seagrass meadows and to characterize their seasonal dynamics.
The team first developed an algorithm to quantify seagrass cover and biomass.
They then applied the algorithms to S2 imagery to provide high-resolution maps of percent cover and leaf biomass. This allowed them to provide recommendations for future remote sensing of seagrass meadows.
Their main study sites were located along the European North Atlantic coast. From north to south, they were: (i) Bourgneuf Bay (France), (ii) Marennes-Oléron Bay (France), and (iii) Cadiz Bay (Spain). Bourgneuf Bay was the main study site, with Marennes-Oléron and Cadiz Bays used only for algorithm evaluation (the process of assessing a property or properties of an algorithm).
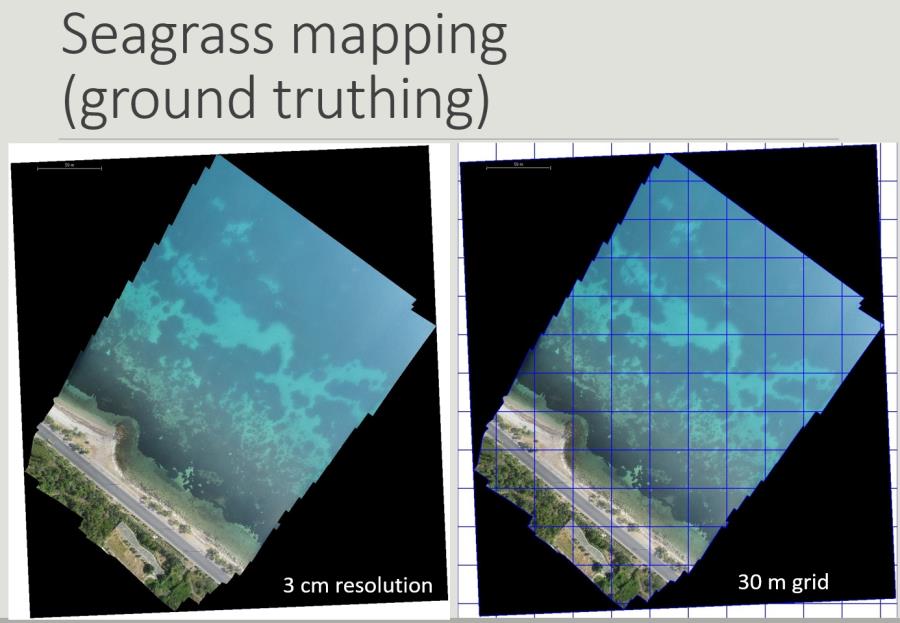
Seagrass imagery taken via remotely sensed satellite imagery. 3 cm resolution (left) and the view based on a 30 m grid (right). Image source: Marine Remote Sensing Group 2017
How did they do?
As a reminder, Dr. Zoffoli and team developed and validated algorithms to estimate seagrass percent cover (SPC) and seagrass leaf biomass (SB) from Sentinel-2 (S2) remote sensing data. These algorithms were derived using in situ measurements made in Z. noltei-dominated meadows in multiple years and locations. The geographic extent of their sampling also made their algorithms applicable from North Africa to North Europe, where Z. noltei occurs. The detailed descriptions of algorithm development and assessment also set guidelines to easily adapt the algorithm to meadows dominated by other species, as long as the emerged seagrasses can be observed during low-tide.
The performance of S2 intertidal seagrass meadow mapping enabled the observation of characteristic features of the meadow, as well as revealed a spatial resolution that allows the monitoring of patch dynamics within the meadow. Valuable information about seasonal seagrass dynamics was also able to be obtained due to the frequent S2 revisit time, and it was possible to characterize the seasonal cycle of the seagrass meadow for two consecutive years on a refined time-scale.
At the French Bourgneuf Bay case study site, the Z. noltei seasonal cycle was characterized by a growing season from mid-May to the beginning of December, a late- summer maximum, and a winter minimum, matching the overall temporal variation found from previous works based on in situ observations.
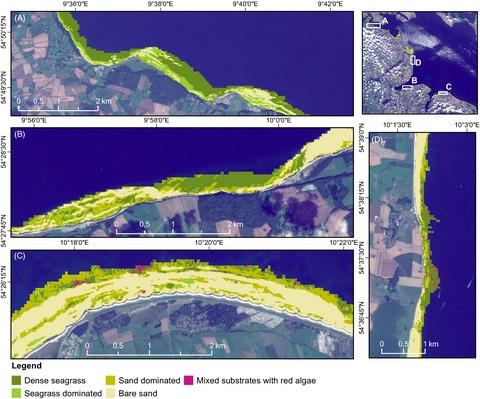
An example of classified seagrass percent cover, including dense seagrass, sand, mixed substrate, and bare sand classes. Image source: Kuhwald, et al. 2021
Future work: thoughts
Future work of interest would be the automated retrieval of the phenological parameters developed here to study interannual changes over a broader geographic scale to evaluate latitudinal patterns in phenology (the study of cyclic and seasonal natural phenomena in relation to plant life).
The S2 dataset is quite recent, but could be complemented by multispectral satellite time-series to investigate long-term changes in seagrass dynamics. For this purpose, the team also provided guidelines to inter-calibrate (calibrate between two or more instruments or sets of data), and they recommend the application of consistent atmospheric correction (removal of the scattering and absorption effects from the atmosphere), if possible, so as to avoid instrumental biases and misinterpretation of temporal changes.
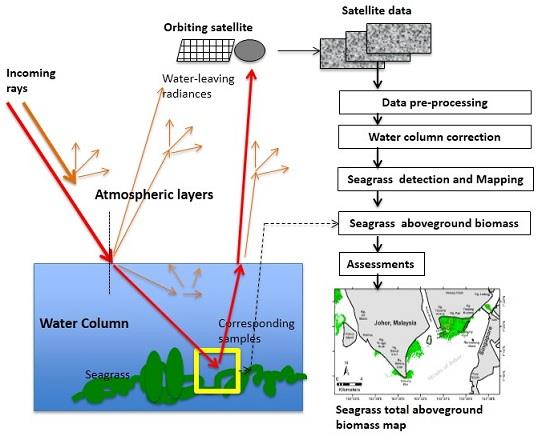
The process of going from obtaining satellite imagery to assessing seagrass percentage cover. Image source: Misbari, et al. 2016